AI tutor
Welcome to Bytelearn!
Let’s check out your problem:

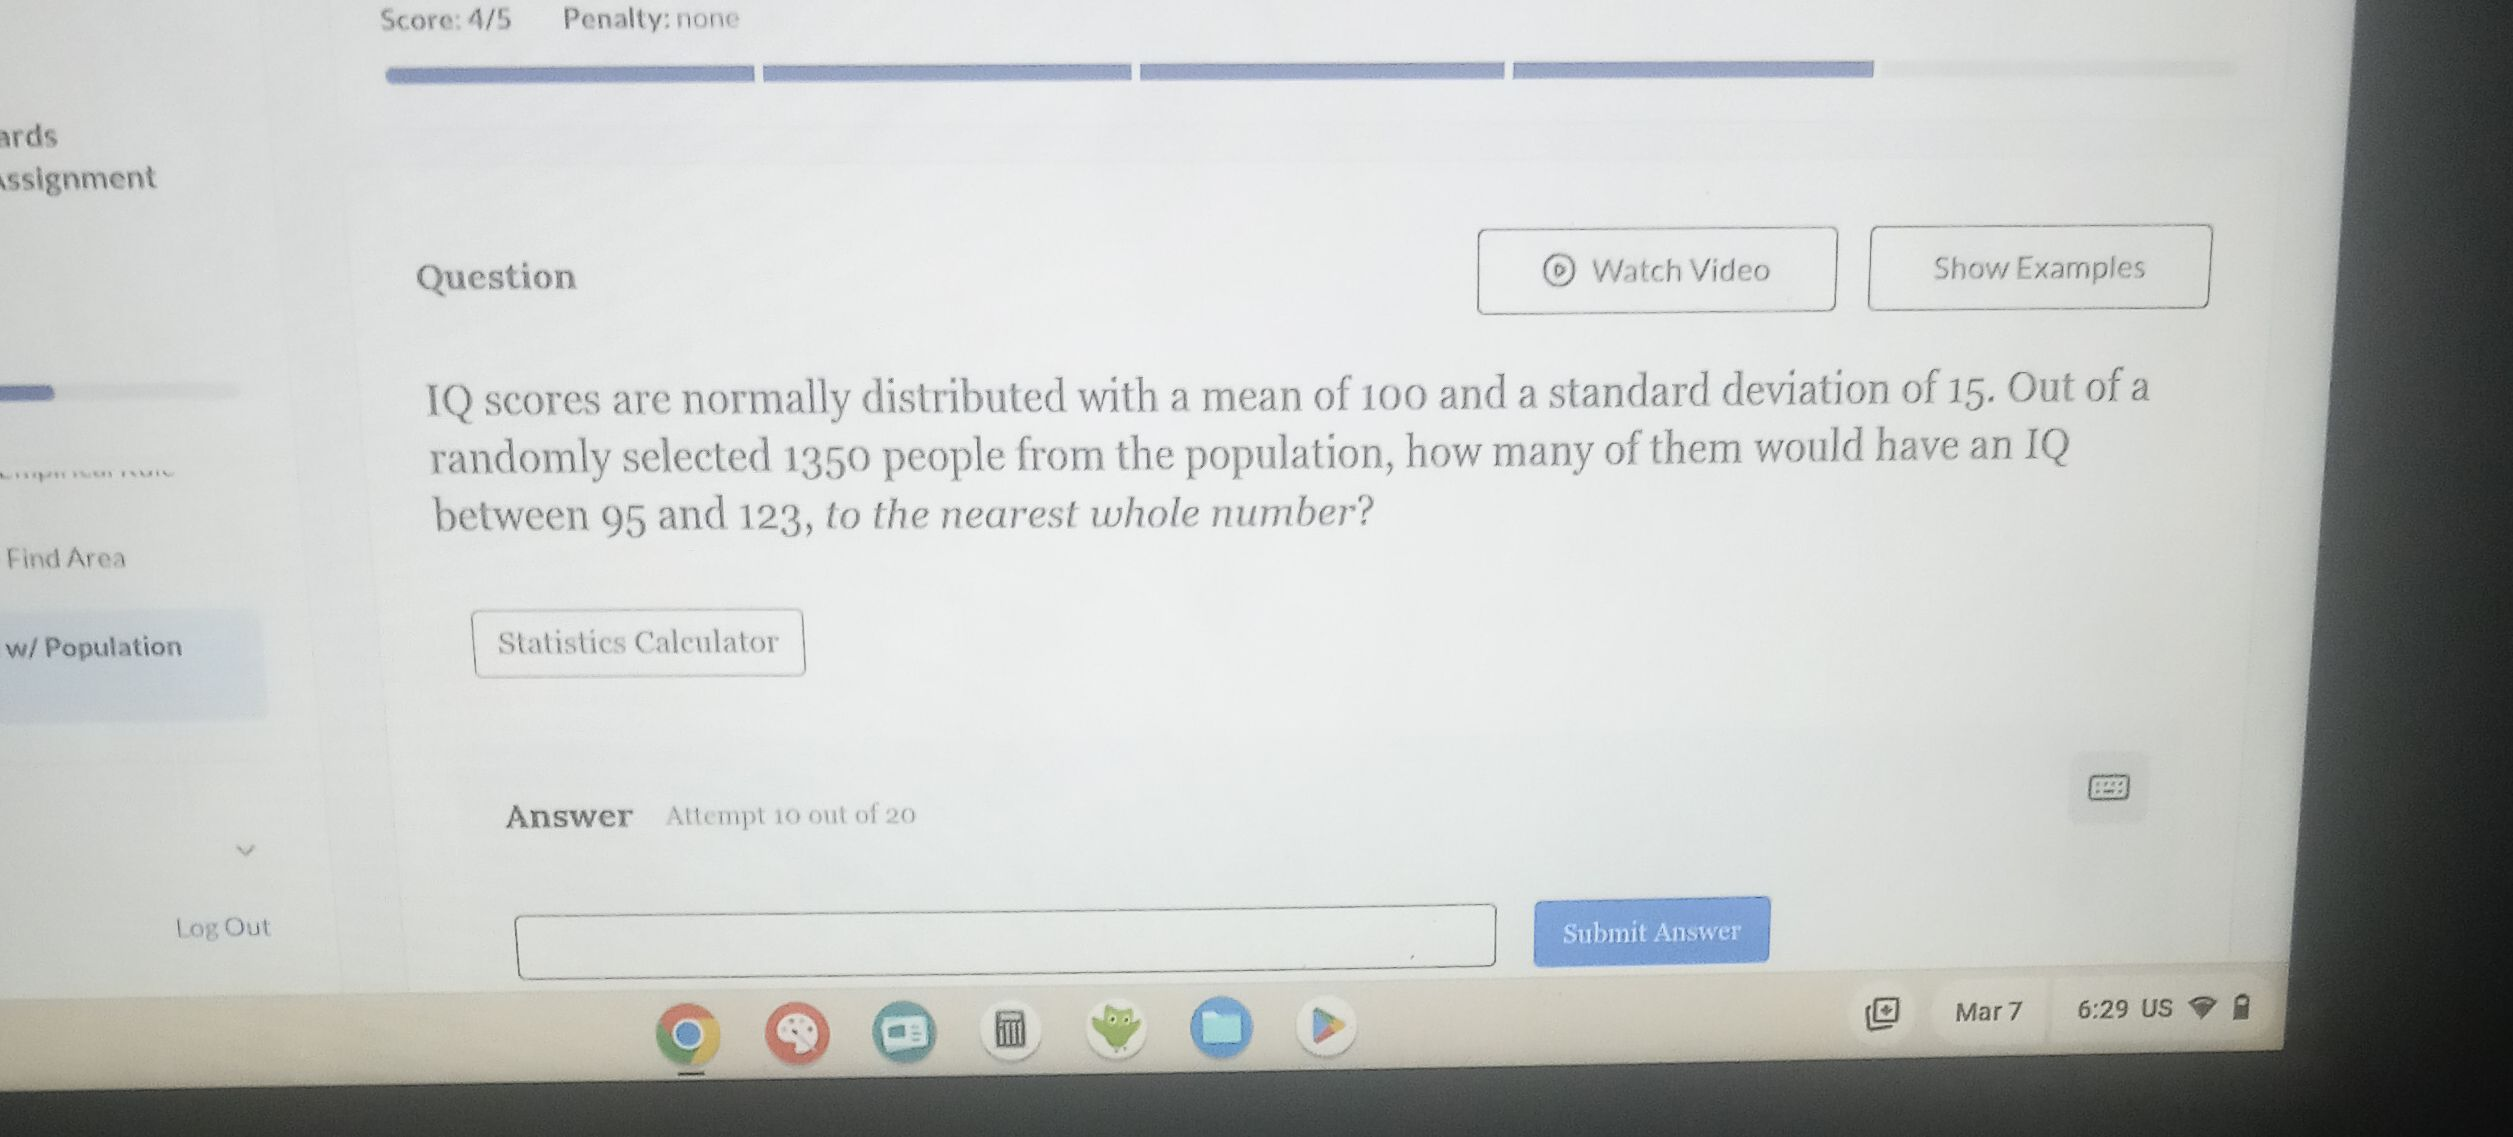
IQ scores are normally distributed with a mean of and a standard deviation of . Out of a randomly selected people from the population, how many of them would have an IQ between and , to the nearest whole number?
Full solution
Q. IQ scores are normally distributed with a mean of and a standard deviation of . Out of a randomly selected people from the population, how many of them would have an IQ between and , to the nearest whole number?
- Identify Mean and Standard Deviation: Identify the mean and standard deviation of the IQ scores.Mean () = Standard deviation () =
- Calculate Z-Scores: Calculate the z-scores for the IQ scores of and . The z-score formula is , where is the value from the data set. For IQ = : For IQ = :
- Find Area Under the Curve: Use the standard normal distribution table or a calculator to find the area under the curve between the -scores of and . The area under the curve from the mean to is approximately . The area under the curve from the mean to is approximately .
- Calculate Area Between Z-Scores: Calculate the area between the two z-scores by subtracting the area from the mean to from the area from the mean to .Area between and =
- Find Number of People: Multiply the area by the total number of people to find the number of people with an IQ between and . Number of people Total population Area between -scores Number of people
- Round to Nearest Whole Number: Round the result to the nearest whole number, as we cannot have a fraction of a person.Number of people
More problems from Scale drawings: word problems
QuestionGet tutor help
QuestionGet tutor help
QuestionGet tutor help
QuestionGet tutor help
QuestionGet tutor help
