AI tutor
Welcome to Bytelearn!
Let’s check out your problem:

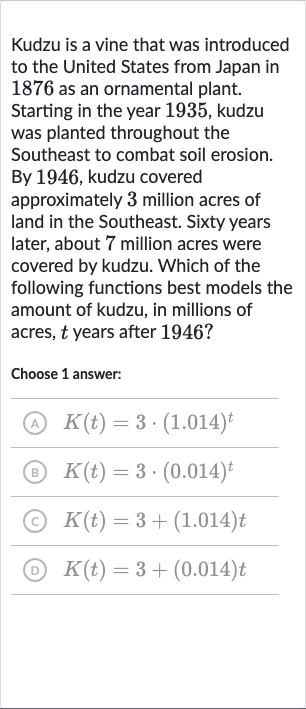
Kudzu is a vine that was introduced to the United States from Japan in as an ornamental plant. Starting in the year , kudzu was planted throughout the Southeast to combat soil erosion. By , kudzu covered approximately million acres of land in the Southeast. Sixty years later, about million acres were covered by kudzu. Which of the following functions best models the amount of kudzu, in millions of acres, years after ?Choose answer:
Full solution
Q. Kudzu is a vine that was introduced to the United States from Japan in as an ornamental plant. Starting in the year , kudzu was planted throughout the Southeast to combat soil erosion. By , kudzu covered approximately million acres of land in the Southeast. Sixty years later, about million acres were covered by kudzu. Which of the following functions best models the amount of kudzu, in millions of acres, years after ?Choose answer:
- Understand Growth Nature: To determine which function best models the growth of kudzu over time, we need to understand the nature of the growth. Since the acreage covered by kudzu increased from million acres in to million acres years later, we are dealing with a growth process over time, which is typically modeled by an exponential function rather than a linear one.
- Calculate Growth Rate: We can calculate the average annual growth rate using the given data. In , there were million acres of kudzu, and by ( years later), there were million acres. The formula for exponential growth is , where is the amount after time , is the initial amount, is the growth rate, and is the time in years.
- Evaluate Option (A): We can set up the equation with the known values: . To find the growth rate , we would need to solve for , which involves taking the th root of and subtracting . However, since we are choosing from given options, we can look for the option that fits the form of the exponential growth equation with the correct initial value and a growth factor that makes sense given the data.
- Evaluate Option (B): Option (A) starts with the correct initial value of million acres and has a growth factor slightly above , which suggests a positive growth rate over time. This option seems to represent an exponential growth model.
- Evaluate Option (C): Option (B) also starts with the correct initial value of million acres, but the growth factor is much less than , which would suggest a rapid decline, not growth. This option does not fit the data.
- Evaluate Option (D): Option (C) represents a linear growth model with a starting value of million acres and an additional million acres per year. This does not match the exponential growth pattern observed in the data.
- Select Best Model: Option (D) also represents a linear growth model with a starting value of million acres and an additional million acres per year. This growth rate is too small to account for the increase to million acres over years and does not match the exponential growth pattern.
- Select Best Model: Option (D) also represents a linear growth model with a starting value of million acres and an additional million acres per year. This growth rate is too small to account for the increase to million acres over years and does not match the exponential growth pattern.Based on the analysis of the options, option (A) is the only one that represents an exponential growth model with a reasonable growth rate that could result in the acreage of kudzu increasing from million to million over years. Therefore, option (A) is the best model for the amount of kudzu, in millions of acres, years after .
More problems from Volume of cubes and rectangular prisms: word problems
QuestionGet tutor help
QuestionGet tutor help
QuestionGet tutor help
QuestionGet tutor help
QuestionGet tutor help
QuestionGet tutor help
QuestionGet tutor help
QuestionGet tutor help
QuestionGet tutor help
