AI tutor
Welcome to Bytelearn!
Let’s check out your problem:

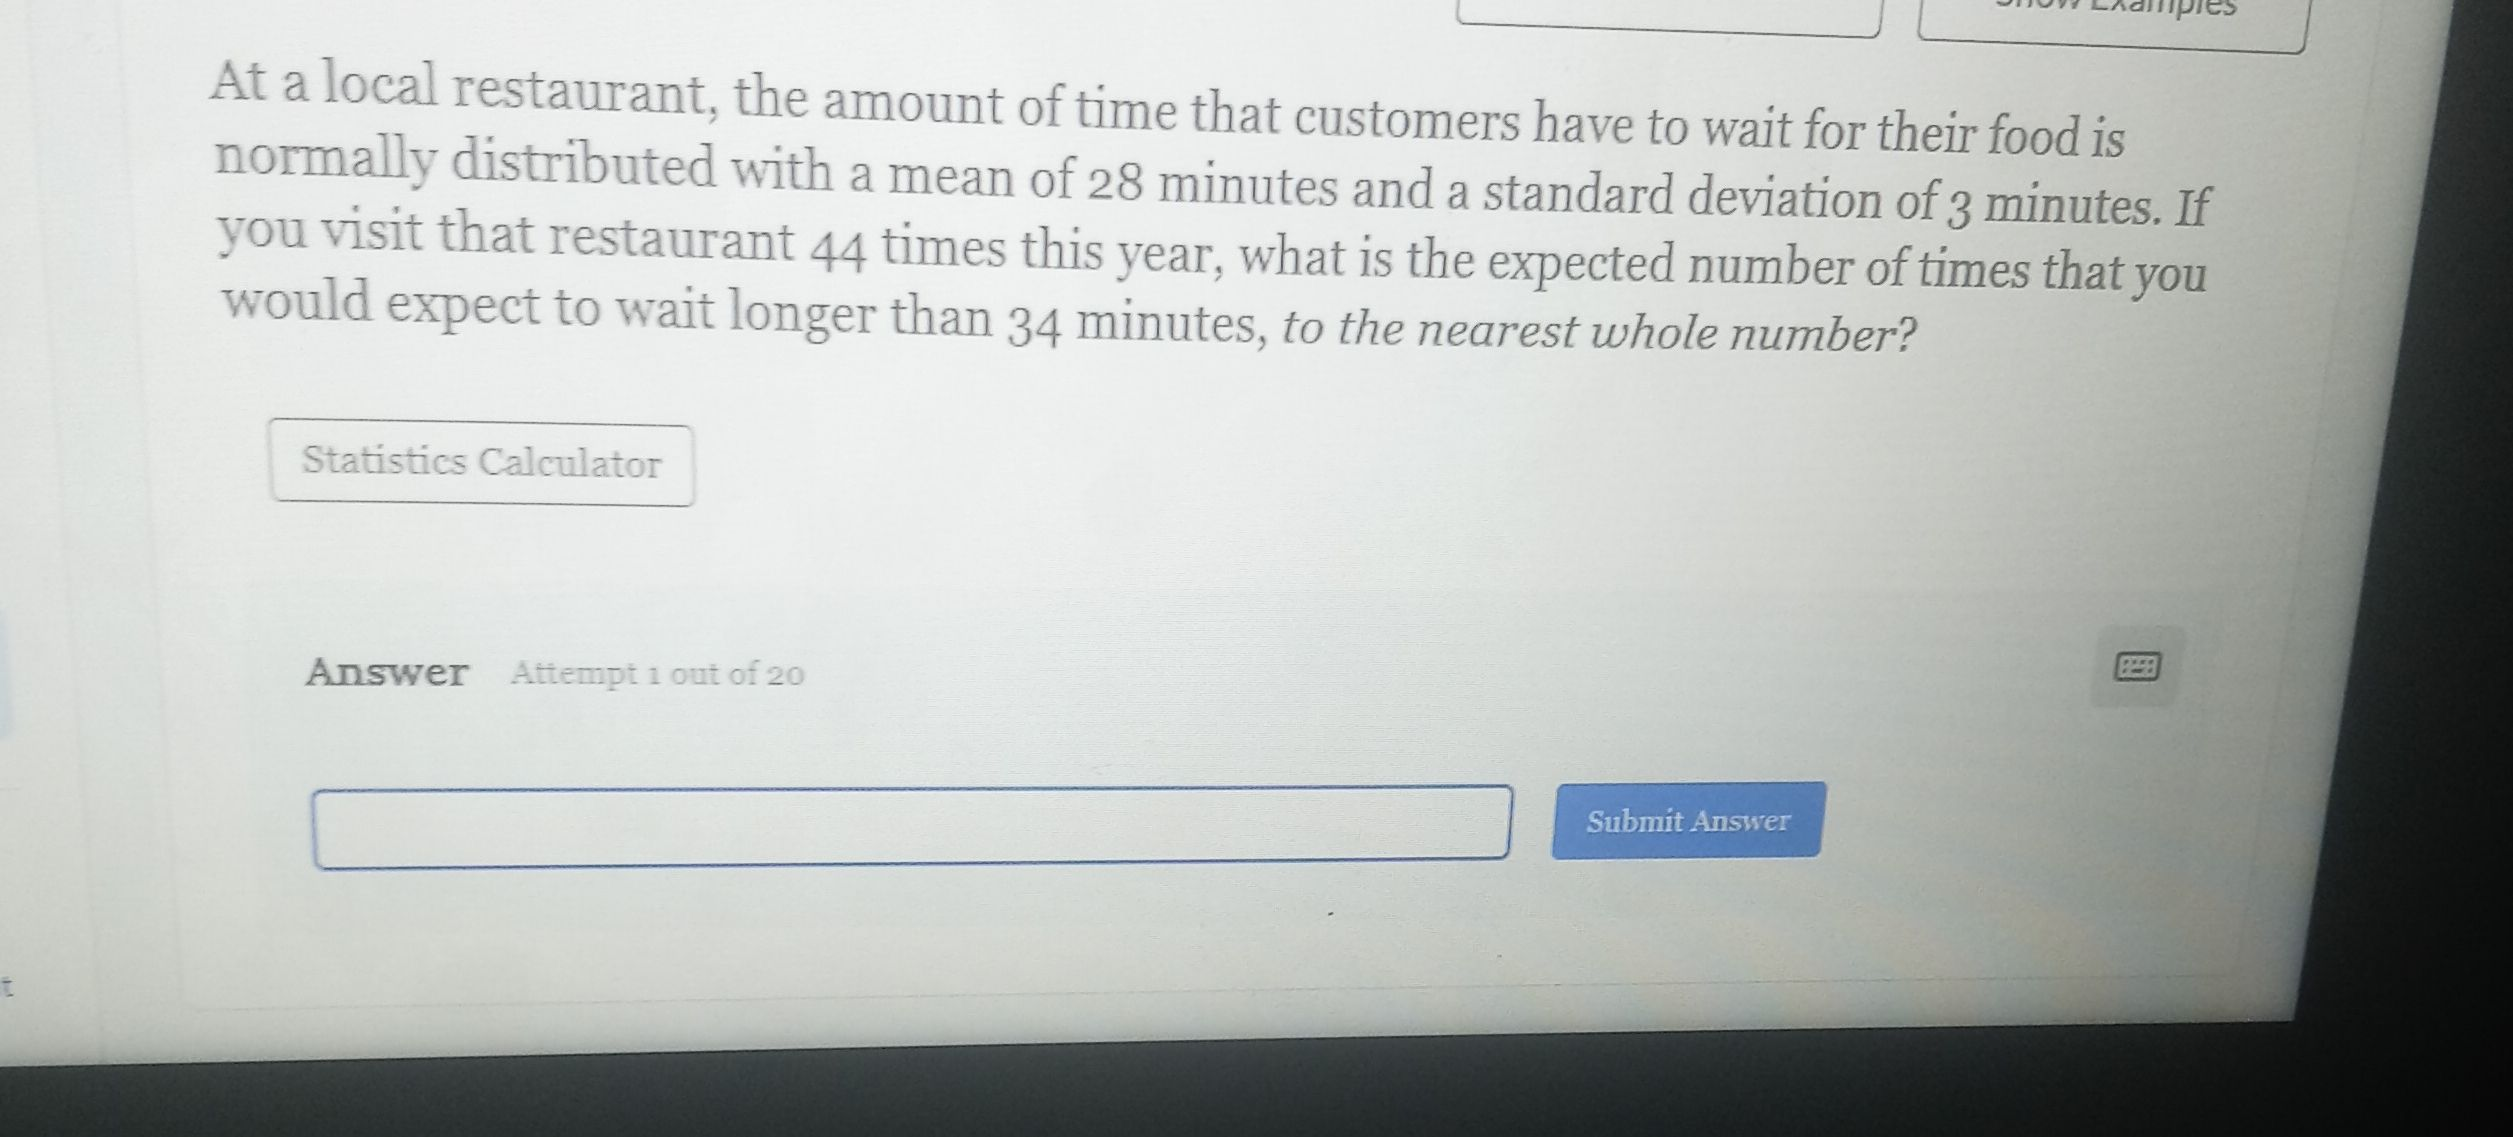
At a local restaurant, the amount of time that customers have to wait for their food is normally distributed with a mean of minutes and a standard deviation of minutes. If you visit that restaurant times this year, what is the expected number of times that you would expect to wait longer than minutes, to the nearest whole number?
Full solution
Q. At a local restaurant, the amount of time that customers have to wait for their food is normally distributed with a mean of minutes and a standard deviation of minutes. If you visit that restaurant times this year, what is the expected number of times that you would expect to wait longer than minutes, to the nearest whole number?
- Identify Parameters: Identify the parameters of the normal distribution. The mean is minutes, and the standard deviation is minutes. We want to find the probability of waiting longer than minutes.
- Calculate Z-Score: Calculate the z-score for minutes.The z-score formula is , where X is the value we are comparing to the mean.So, .
- Find Probability: Use the z-score to find the probability of waiting longer than minutes.A z-score of corresponds to a probability of about . for the area to the left of the z-score in the standard normal distribution table. To find the probability of waiting longer than minutes, we need to find the area to the right of the z-score, which is .
- Calculate Expected Number: Calculate the expected number of times you will wait longer than minutes out of visits.To find the expected number of times, multiply the probability by the number of visits..
- Round Result: Round the result to the nearest whole number.Since we can't visit a fraction of a time, we round to the nearest whole number, which is .
More problems from Find probabilities using the binomial distribution
QuestionGet tutor help
QuestionGet tutor help
QuestionGet tutor help
QuestionGet tutor help
QuestionGet tutor help
QuestionGet tutor help
QuestionGet tutor help
QuestionGet tutor help
QuestionGet tutor help
QuestionGet tutor help
