AI tutor
Welcome to Bytelearn!
Let’s check out your problem:

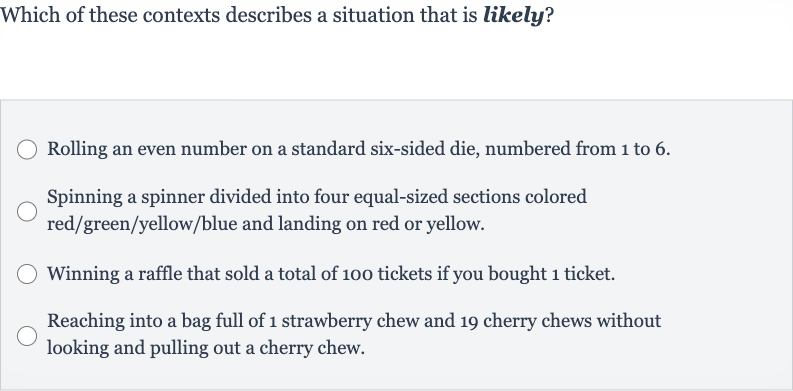
Which of these contexts describes a situation that is likely?Rolling an even number on a standard six-sided die, numbered from to .Spinning a spinner divided into four equal-sized sections colored red/green/yellow/blue and landing on red or yellow.Winning a raffle that sold a total of tickets if you bought ticket.Reaching into a bag full of strawberry chew and cherry chews without looking and pulling out a cherry chew.
Full solution
Q. Which of these contexts describes a situation that is likely?Rolling an even number on a standard six-sided die, numbered from to .Spinning a spinner divided into four equal-sized sections colored red/green/yellow/blue and landing on red or yellow.Winning a raffle that sold a total of tickets if you bought ticket.Reaching into a bag full of strawberry chew and cherry chews without looking and pulling out a cherry chew.
- Rolling Even Number Probability: Analyze the likelihood of rolling an even number on a standard six-sided die. A standard six-sided die has three even numbers () and three odd numbers (). The probability of rolling an even number is the number of even outcomes divided by the total number of outcomes. Probability = Number of even outcomes / Total number of outcomes Probability = Probability = This means there is a chance of rolling an even number, which is likely.
- Spinner Landing Probability: Analyze the likelihood of spinning a spinner divided into four equal-sized sections and landing on red or yellow.The spinner has four sections, and landing on either red or yellow would be considered a successful outcome. There are two favorable outcomes (red, yellow) out of four possible outcomes.Probability = Number of favorable outcomes (red or yellow) / Total number of outcomesProbability = Probability = This means there is a chance of landing on red or yellow, which is also likely.
- Raffle Winning Probability: Analyze the likelihood of winning a raffle with tickets sold and you bought ticket.The probability of winning the raffle is the number of tickets you bought divided by the total number of tickets sold.Probability = Number of tickets you bought / Total number of tickets soldProbability = This means there is a chance of winning the raffle, which is not very likely.
- Bag Pulling Probability: Analyze the likelihood of reaching into a bag with strawberry chew and cherry chews and pulling out a cherry chew.The probability of pulling out a cherry chew is the number of cherry chews divided by the total number of chews.Probability = Probability = This means there is a chance of pulling out a cherry chew, which is very likely.
More problems from Interpret confidence intervals for population means
QuestionGet tutor help
QuestionGet tutor help
QuestionGet tutor help
QuestionGet tutor help
QuestionGet tutor help
QuestionGet tutor help
QuestionGet tutor help
