AI tutor
Full solution
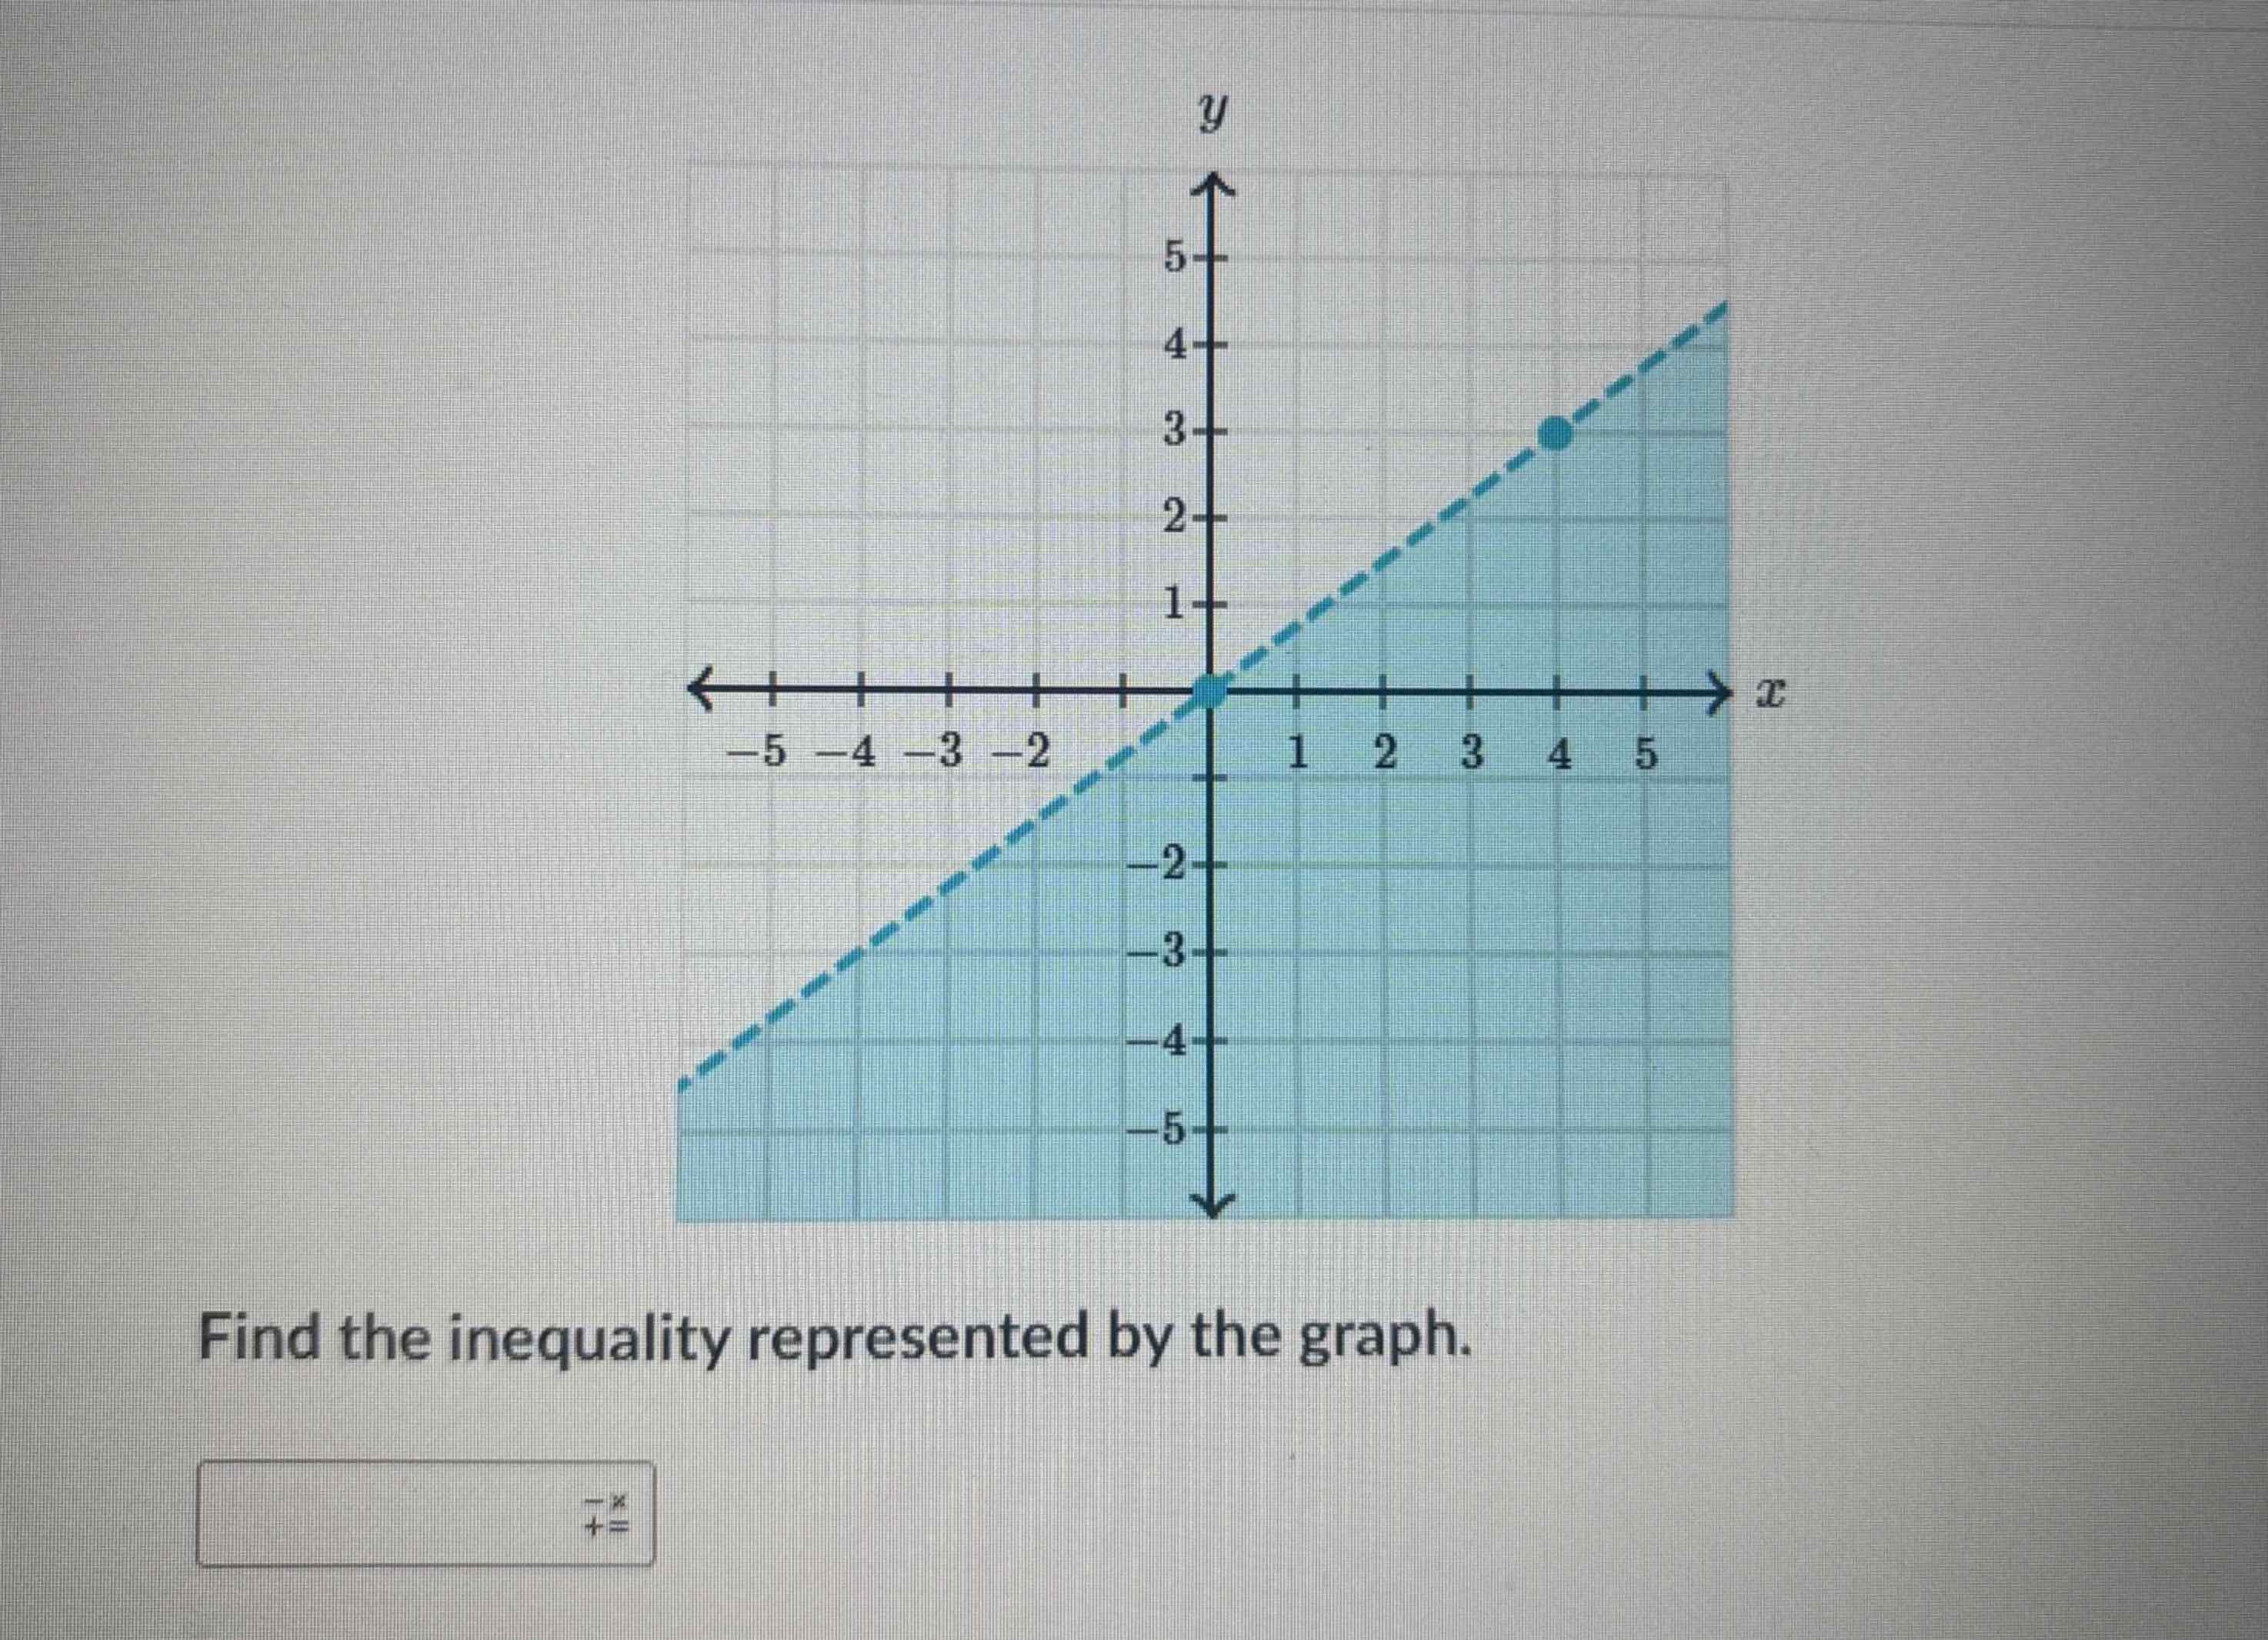
Q. Find the inequality represented by the graph.
- Identify Line Type: Identify the type of line and shading on the graph. The line is solid and shaded below, indicating "less than or equal to."
- Find Slope and Y-Intercept: Determine the slope and y-intercept of the line from the graph. The line crosses the y-axis at and rises units for every unit it moves right, so the slope is .
- Write Equation in Slope-Intercept Form: Write the equation of the line using the slope-intercept form , where is the slope and is the y-intercept. Here, and , so the equation is .
- Convert Equation to Inequality: Convert the equation of the line to an inequality. Since the shading is below the line, the inequality is .

