AI tutor
Welcome to Bytelearn!
Let’s check out your problem:

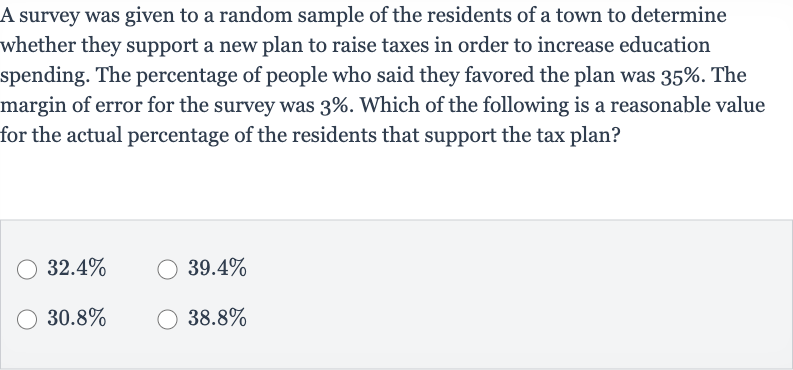
A survey was given to a random sample of the residents of a town to determine whether they support a new plan to raise taxes in order to increase education spending. The percentage of people who said they favored the plan was . The margin of error for the survey was . Which of the following is a reasonable value for the actual percentage of the residents that support the tax plan?
Full solution
Q. A survey was given to a random sample of the residents of a town to determine whether they support a new plan to raise taxes in order to increase education spending. The percentage of people who said they favored the plan was . The margin of error for the survey was . Which of the following is a reasonable value for the actual percentage of the residents that support the tax plan?
- Understand Margin of Error: Understand the concept of margin of error. The margin of error in a survey gives us a range in which the true value is likely to fall. In this case, the margin of error is . This means that the actual percentage of residents who support the tax plan could be higher or lower than the reported .
- Calculate Lower End: Calculate the lower end of the margin of error.To find the lower end of the range, we subtract the margin of error from the reported percentage.
- Calculate Upper End: Calculate the upper end of the margin of error.To find the upper end of the range, we add the margin of error to the reported percentage.
- Determine Reasonable Values: Determine the reasonable values for the actual percentage. The reasonable values for the actual percentage of residents that support the tax plan would fall between and . Therefore, any value outside this range would not be considered reasonable given the margin of error.
- Compare with Options: Compare the given options with the calculated range.We have the following options:- - - - We can see that and fall within the range of to , while and do not.
More problems from Interpret confidence intervals for population means
QuestionGet tutor help
QuestionGet tutor help
QuestionGet tutor help
QuestionGet tutor help
QuestionGet tutor help
QuestionGet tutor help
QuestionGet tutor help
