

AI tutor


Welcome to Bytelearn!
Let’s check out your problem:
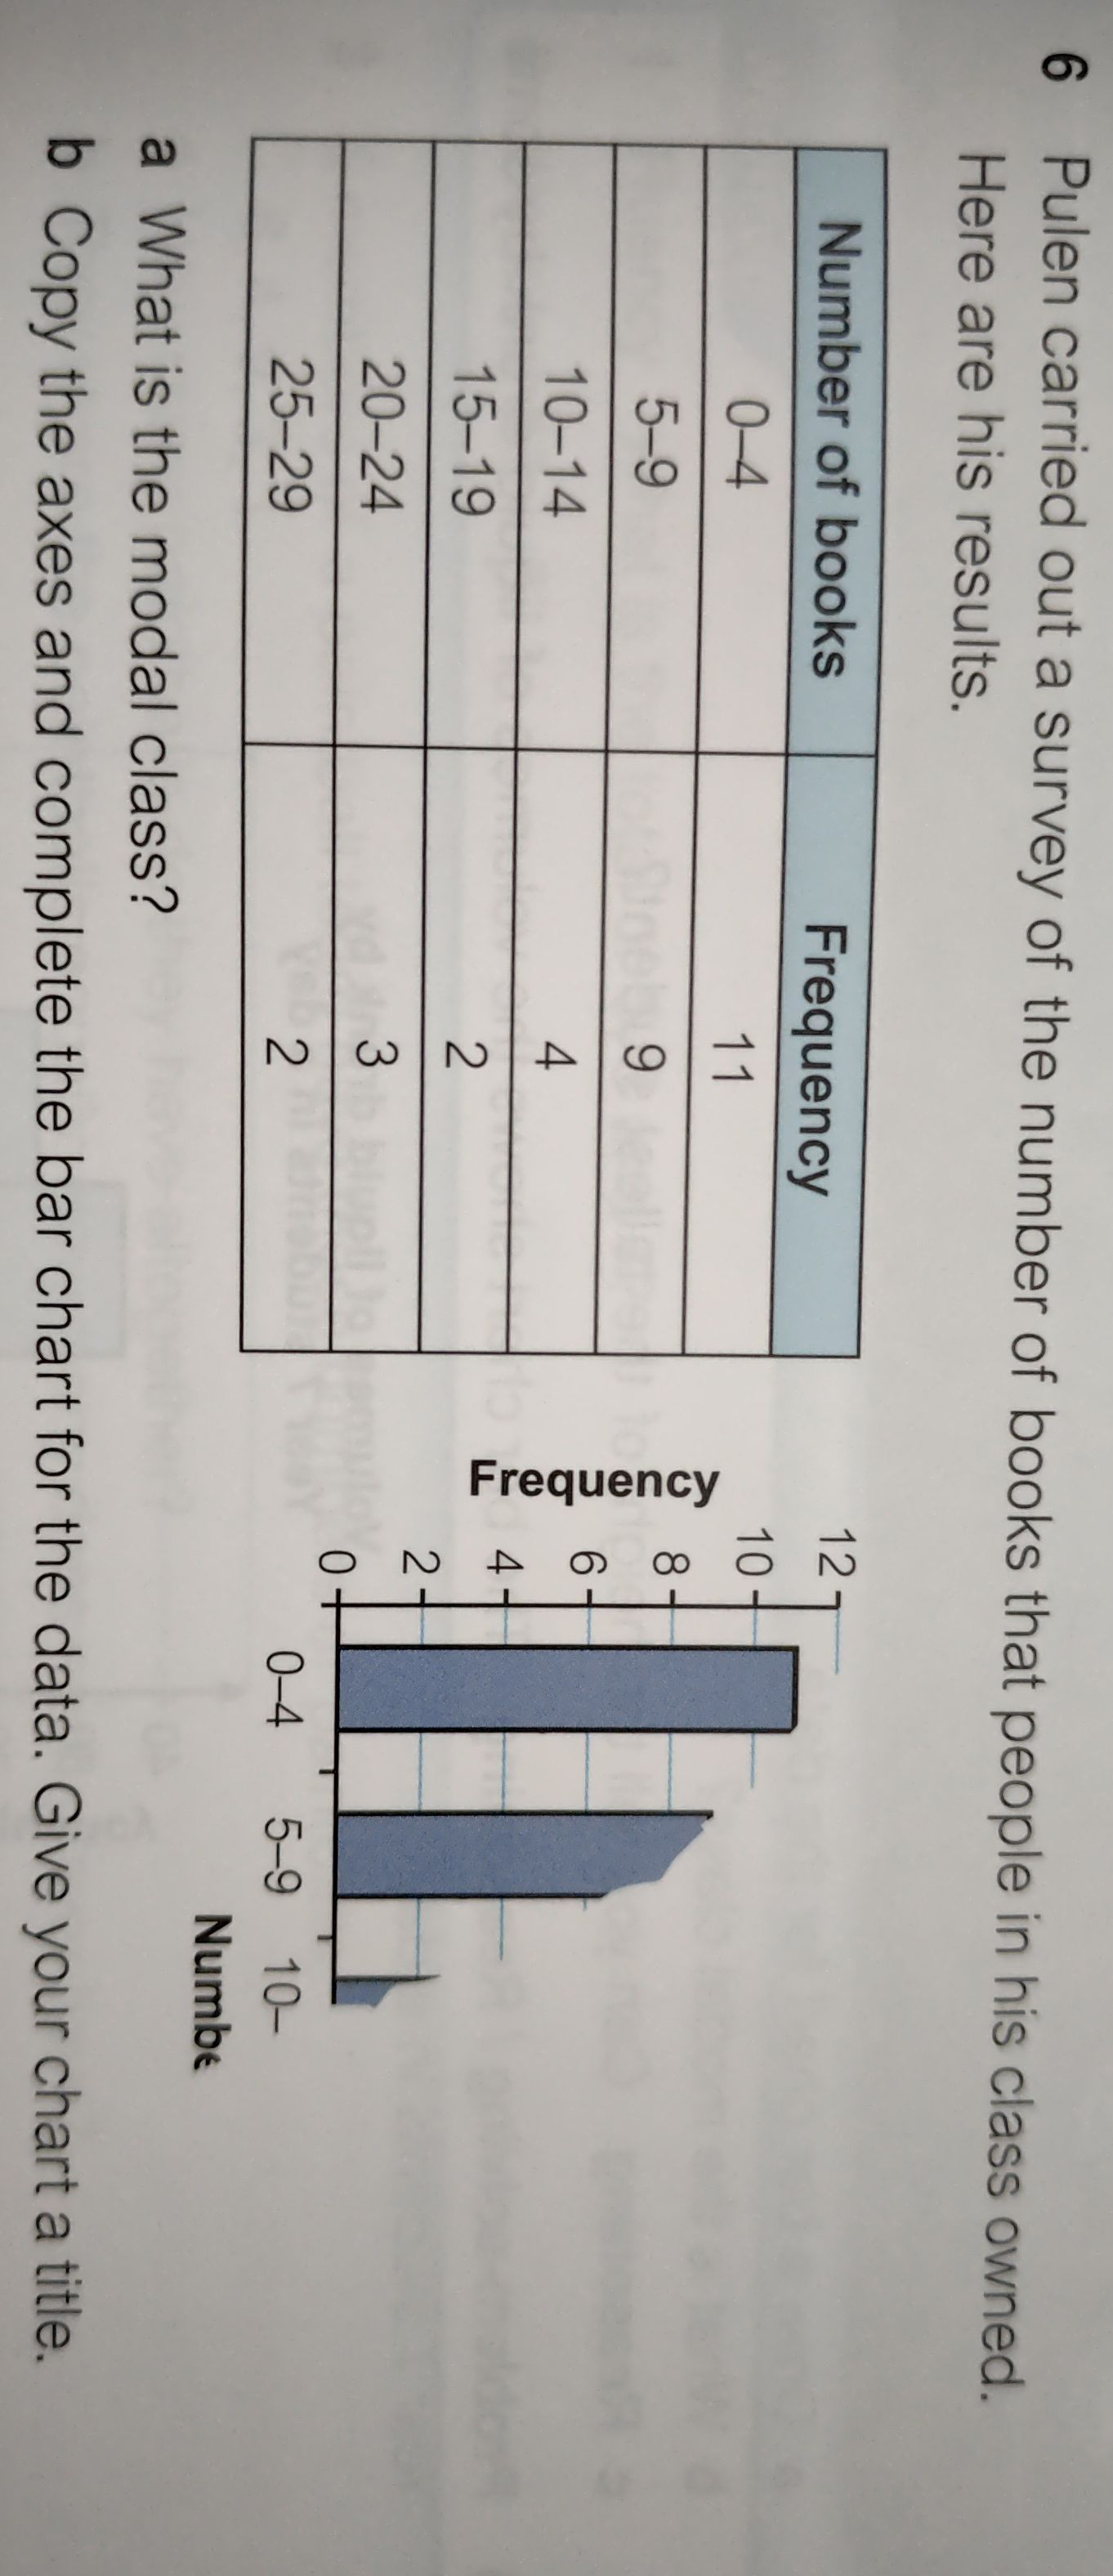
Pulen carried out a survey of the number of books that people in his class owned. Here are his results.\begin{tabular}{|c|c|}\hline Number of books & Frequency \\\hline & \\\hline & \\\hline & \\\hline & \\\hline & \\\hline & \\\hline\end{tabular}a What is the modal class?b Copy the axes and complete the bar chart for the data. Give your chart a title.


Full solution
Q. Pulen carried out a survey of the number of books that people in his class owned. Here are his results.\begin{tabular}{|c|c|}\hline Number of books & Frequency \\\hline & \\\hline & \\\hline & \\\hline & \\\hline & \\\hline & \\\hline\end{tabular}a What is the modal class?b Copy the axes and complete the bar chart for the data. Give your chart a title.
- Identify Modal Class: Identify the modal class by finding the class interval with the highest frequency.
- Draw Axes: Draw the axes for the bar chart. Label the x-axis with the class intervals and the y-axis with the frequency.
- Plot Bars: Plot the bars for each class interval according to their frequencies.
- Title Chart: Title the bar chart as "Number of Books Owned by Students".
