AI tutor
Welcome to Bytelearn!
Let’s check out your problem:

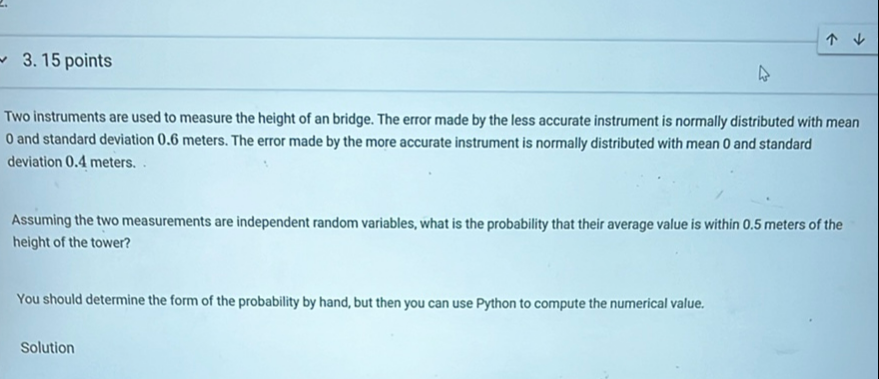
Two instruments are used to measure the height of an bridge. The error made by the less accurate instrument is normally distributed with mean and standard deviation . meters. The error made by the more accurate instrument is normally distributed with mean and standard deviation . meters.Assuming the two measurements are independent random variables, what is the probability that their average value is within . meters of the height of the tower?
Full solution
Q. Two instruments are used to measure the height of an bridge. The error made by the less accurate instrument is normally distributed with mean and standard deviation . meters. The error made by the more accurate instrument is normally distributed with mean and standard deviation . meters.Assuming the two measurements are independent random variables, what is the probability that their average value is within . meters of the height of the tower?
- Understand the problem: Understand the problem and determine the distribution of the average error. We are given two independent normal distributions for the errors of two instruments. The first has a mean of and a standard deviation of meters, and the second has a mean of and a standard deviation of meters. We want to find the probability that the average of these two measurements is within meters of the true height of the bridge.
- Calculate standard deviation: Calculate the standard deviation of the average error.Since the two measurements are independent, the variance of the average of the two measurements is the sum of their variances divided by the square of the number of measurements (which is in this case). The variance of the average error is given by:We know that the standard deviation is the square root of the variance, so we need to calculate the standard deviation of each instrument's error and then find the standard deviation of the average error. meters meters meters
- Determine z-scores: Determine the z-scores for the range of acceptable average errors.We want to find the probability that the average error is within meters of the true height. This means we are looking for the probability that the average error is between meters and meters. To find this probability, we need to calculate the z-scores corresponding to these values.For meters:For meters:We will use these z-scores to find the probability.
- Use Python to calculate: Use Python to calculate the probability.We will use Python's scipy.stats library to find the probability that the z-score falls between and . This will give us the probability that the average error is within meters of the true height.pythonfrom scipy.stats import norm# Calculate the probabilitylower_z = upper_z = probability = norm.cdf(upper_z) - norm.cdf(lower_z)We will execute this Python code to get the numerical value of the probability.
More problems from Interpret confidence intervals for population means
QuestionGet tutor help
QuestionGet tutor help
QuestionGet tutor help
QuestionGet tutor help
QuestionGet tutor help
QuestionGet tutor help
QuestionGet tutor help
